¶ Reports
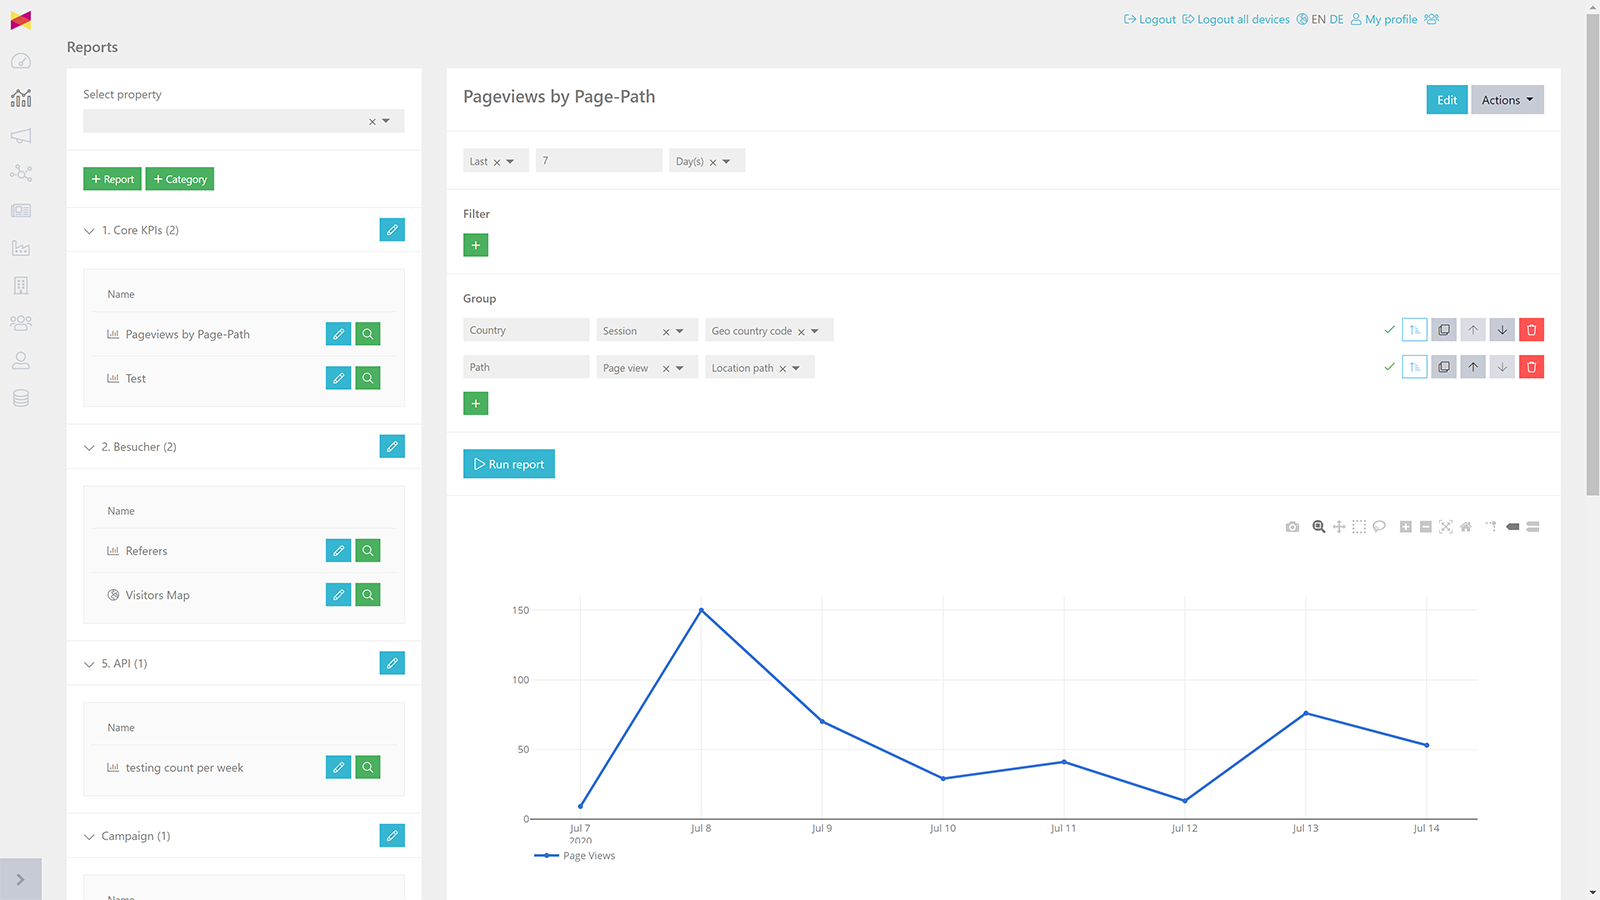
In this example, we are going to explain how you can setup a basic time series report. If you want to create other reports (event, funnel, map) or if you need more detailed information about the time series report, please have a look at the respective report manual.
¶ Create report

Click the "Reports" button in the navigation on the left hand side.

Select the property you would like to create a report for from the property dropdown menu.

Create a report category by clicking the "+ Category" button. Type in a report category name in the modal (e.g. Insights).
Then click the "+ Report" button to create a new report.
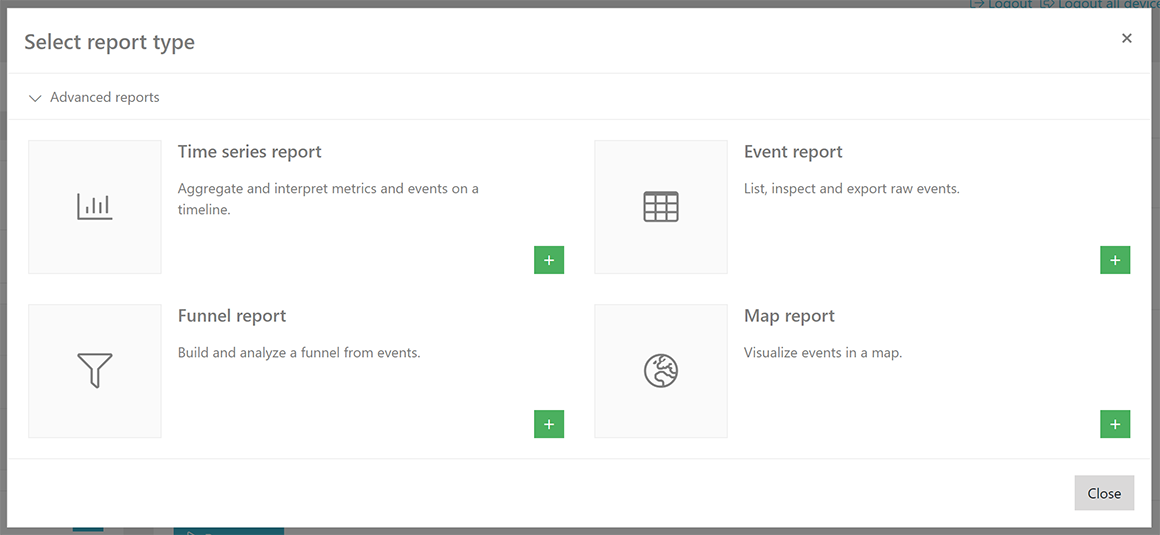
Select the time series report by clicking the "+" button next to the time series report.
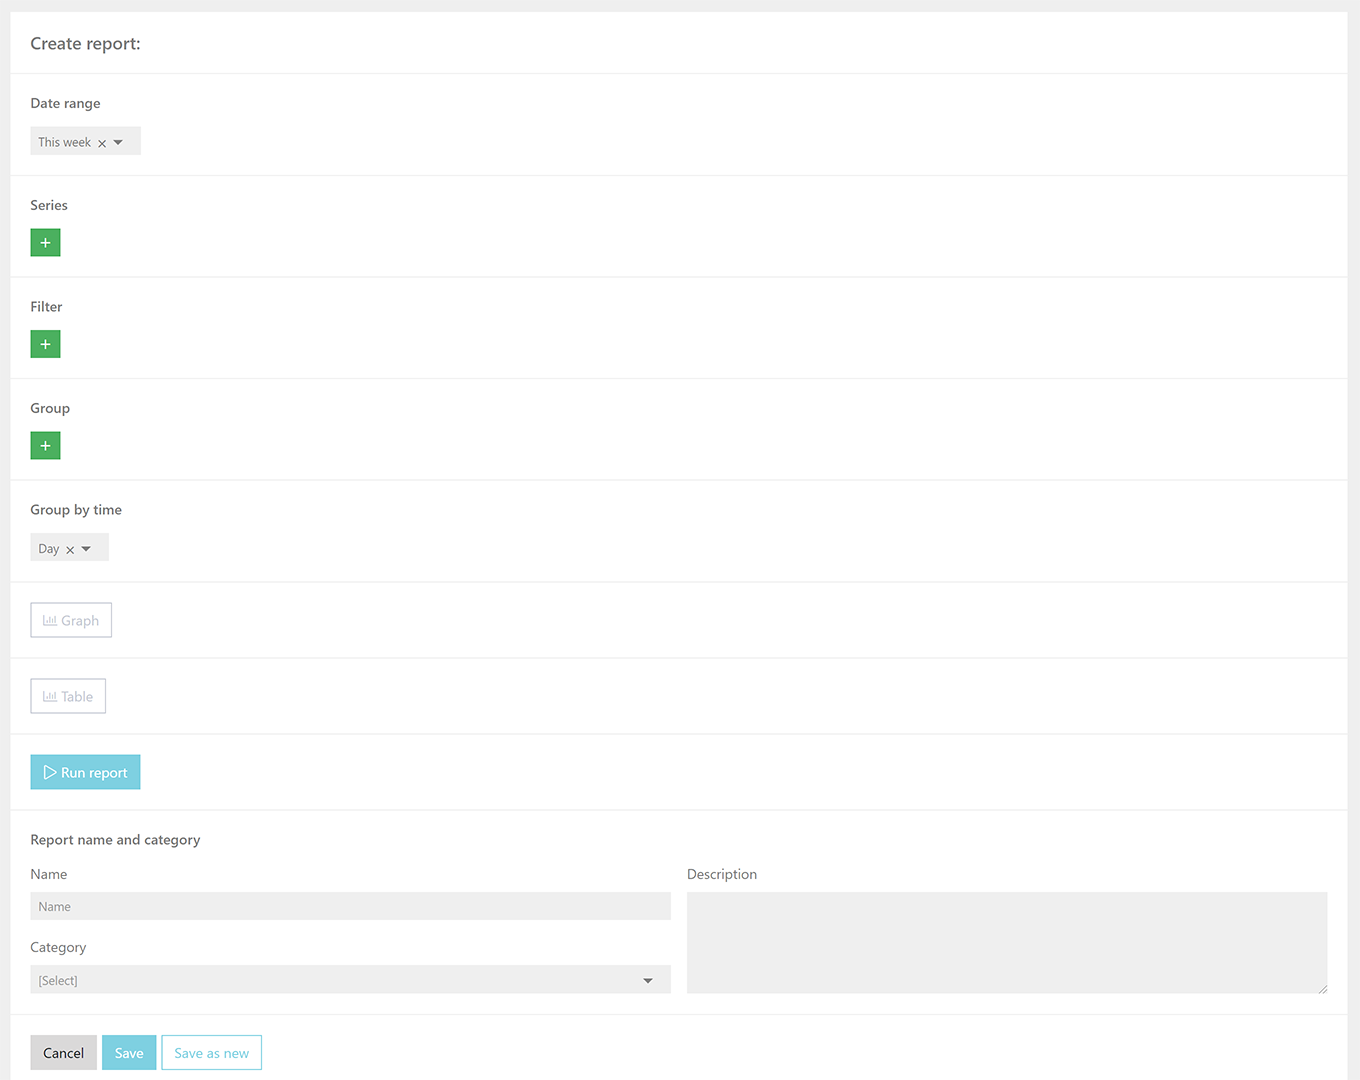
Now you can see the report page in edit mode.
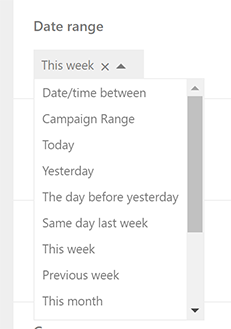
Choose the time range you would like to report on (e.g. This week)
¶ Series

To add a new report series, click the "+" button in the series section.
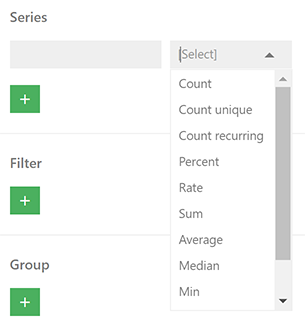
Select what you would like to show in your report series. Select "Count" if you would like to show a count of something. Like the count of pageviews or sessions.
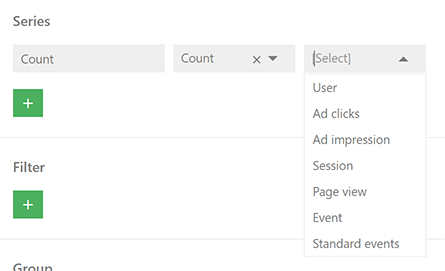
Then choose what you would like to show as a count in your report series. E.g. Session. Please note that the label name is automatically changing according to your selection. You can overwrite the label name by deleting the default name and type in a new name.
You can add as many series as you want.

Following our example you can now add the "Visibility Header" event. All events you create in the tag manager are automatically available under "Event" in the reporting engine.
¶ Filters

To add a new filter, click the "+" button in the filter section.

You have automatically created a filter set. Click the "+" button below "filter set: 1" to add a filter.
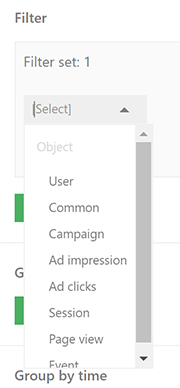
Choose how you want to build your filter. In this example we are going to filter for a specific location path. Choose Page view from the first dropdown.
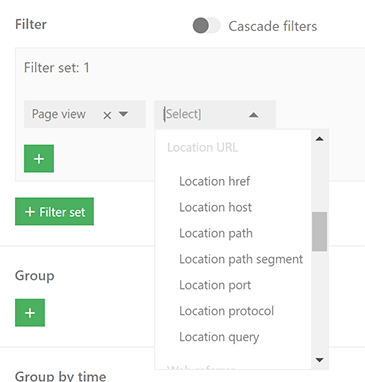
In the second dropdown menu, scroll down and click on "Location path".
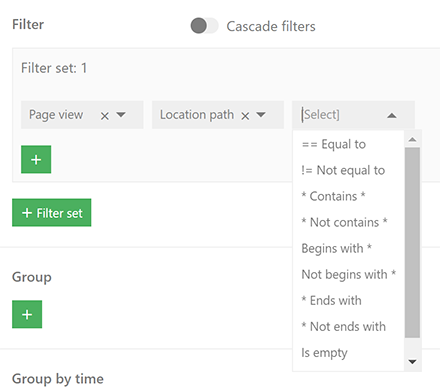
Then select * Contains * from the third dropdown.

Type in the path name you would like to filter on. In this example we use "thankyou" which could be the thankyou page after a conversion.
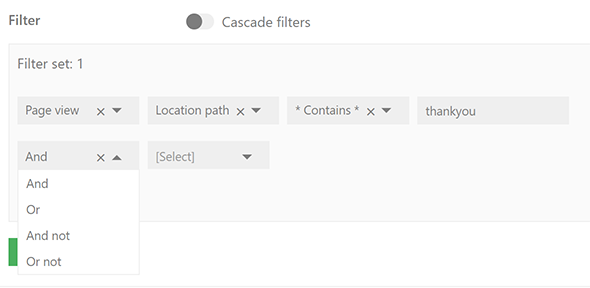
You can create complex filters by combining different filters with an And, Or, An not, Or not operator.
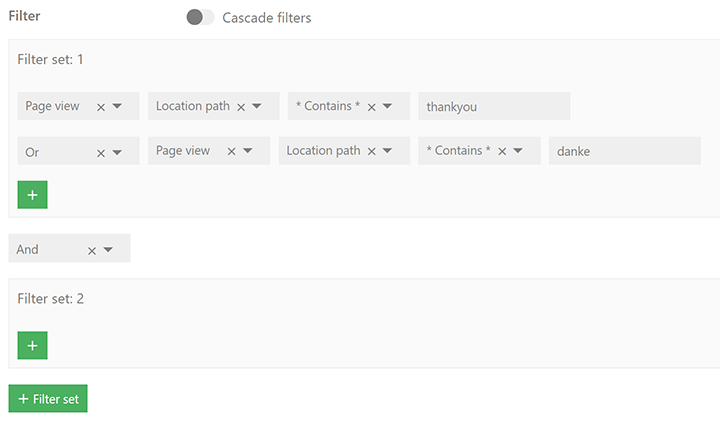
You can also combine different filter sets with the same set of operators.
¶ Groups

To group your data in a certain way, click the "+" button in the group section.
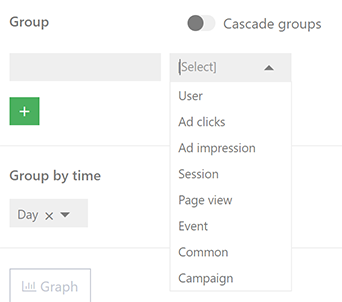
Choose how you would like to group your data. In this example we are going to group by country name. Select "Session" from the first dropdown menu.
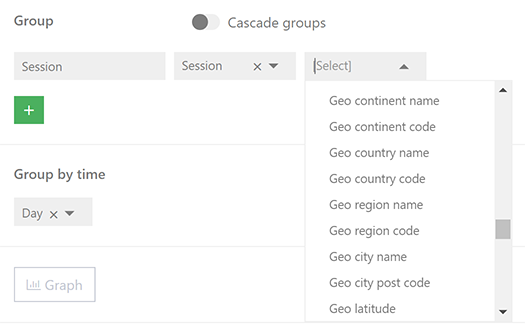
In the second dropdown menu, scroll down and click on "Geo country name". You can also type in "Geo" in the dropdown menu to jump directly to this part. The label name will automatically be set by what you select from the dropdown menus. You can change the label name by deleting the default name and add a new one (e.g. Country).
You can add up to three groups in one report.
¶ Group by time
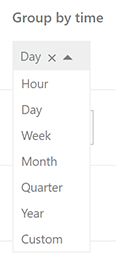
In this step, you can choose if you want to see your data on a daily, weekly, monthly etc. basis. In this example we select "Day". When you click the "x" icon in the dropdown menu, the entire range will be reported.
¶ Graph

If you want to add a graph to your report, click the "Graph" button.
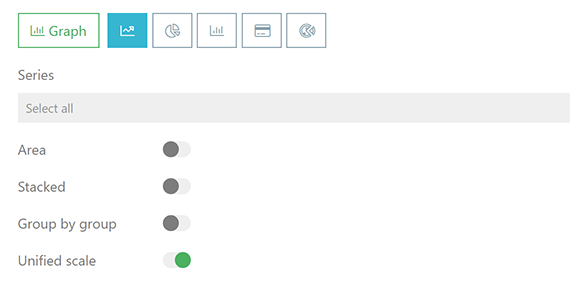
You can now choose from different chart types such as line chart, pie chart, bar chart, card chart and sunray chart. For each chart type, some additional options are available to display the chart exactly how you want it to be.
¶ Table

If you want to add a data table to your report, click the "Table" button.
¶ Run report

Click the "Run report" button to get your results. Please note that the report can take a while to load as you are querying raw data.
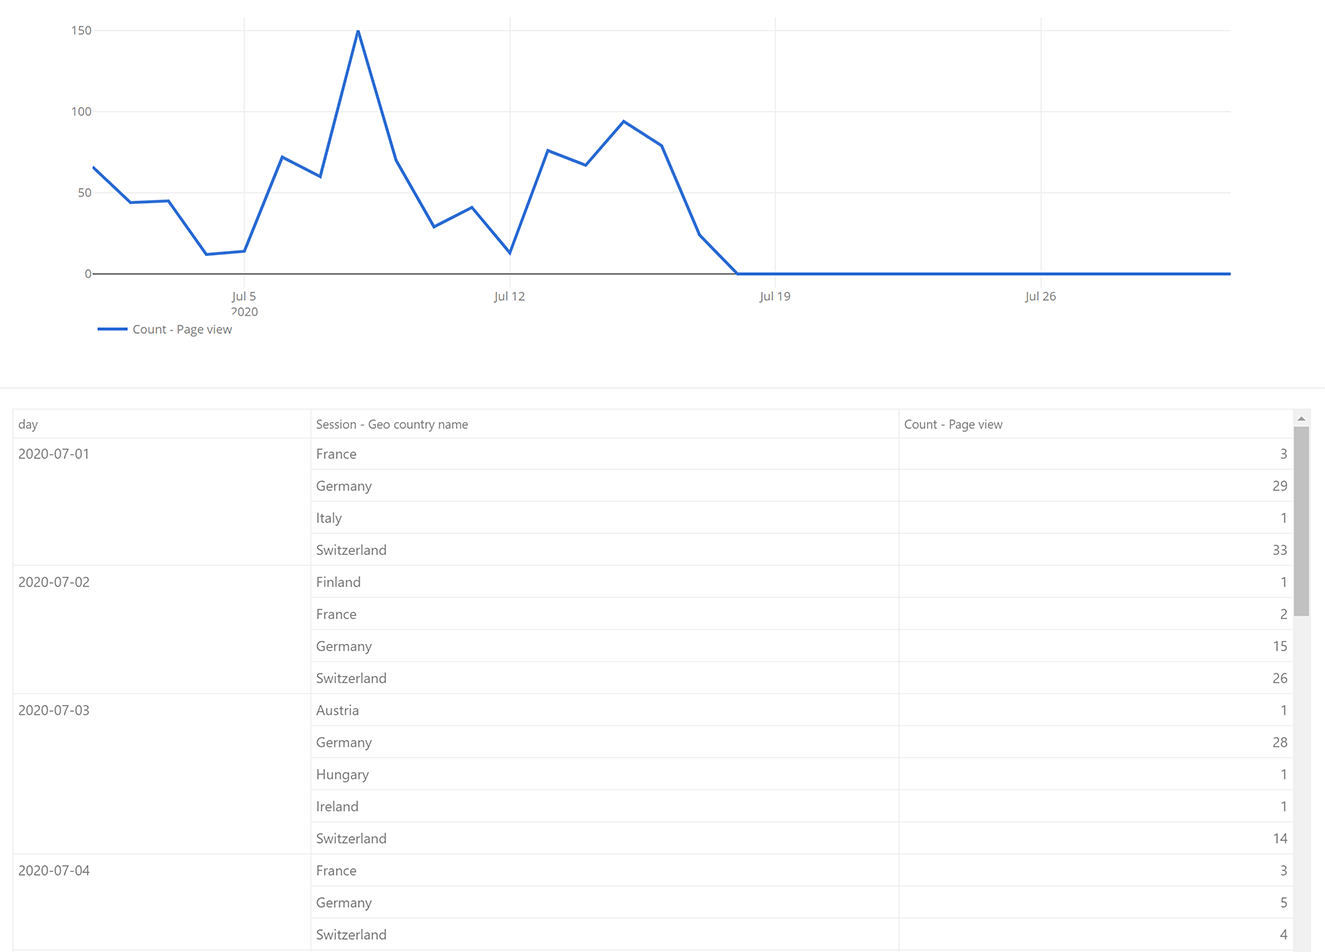
Now you will see the report with all the elements you have selected. If you are not happy with your report, scroll up to the settings, make changes and run the report again.
¶ Name, category and description

As a final step, name your report, select a category where you would like to save your report to and add a short description for other users to understand what the report is all about.
Click the "Save" button to save your report.
¶ View report
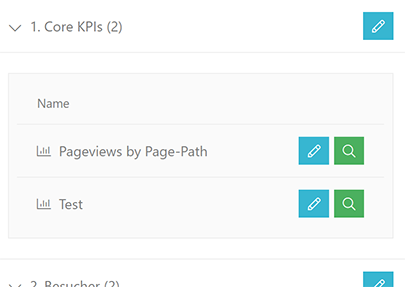
Open a report in view mode by clicking the magnifying glass button next to the report name.
¶ Edit report
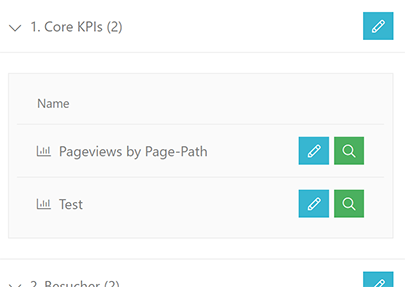
Open a report in edit mode by clicking the edit button next to the report name.

You can also open a report in edit mode by clicking the "Edit" button in the top right corner in the report view mode.
Then make changes in the report settings and click the "Save" button to save your changes.
¶ Duplicate report

To duplicate a report, simply open a report in edit mode, scroll down to the "Report name and category" area, type in a new report name and click the "Save as new" button.